
Ifrs9 Cecl Credit Provisioning
IFRS 9 SICR Quantitative Calibration: Relative Lifetime PD Ratios vs Absolute Basis-Point Thresholds
IFRS 9.5.5.9 defines Significant Increase in Credit Risk (SICR) strictly by comparing remaining-lifetime PD today against remaining-lifetime PD expected at origination—requiring dual relative-ratio and absolute-bps thresholds.
How large a credit deterioration moves a performing loan from Stage 1 (12-Month ECL) into Stage 2 (Lifetime ECL)? Under IFRS 9 paragraphs 5.5.9 and B5.5.1–B5.5.24, Significant Increase in Credit Risk (SICR) is explicitly a relative origination-anchored test—comparing the remaining-lifetime Probability of Default (PD) at the reporting date against the forward remaining-lifetime PD that was expected for that exact residual tenor back on Day 1!
Why You MUST Compare Remaining-Lifetime PD Against Forward Origination Remaining-Lifetime PD!#
Spot the fatal mathematical bug that ECB SSM, EBA, and UK PRA targeted review auditors flag immediately inside our IFRS 9 & ASC 326 CECL cornerstone guide:
- Suppose on Day 0, a bank originates a healthy 10-year loan with cumulative 10-year
Lifetime PD(0 -> 10) = 8.0%. Seven years pass cleanly (t = 7), so only 3 years remain (t = 7 -> 10). Even if the borrower’s annual hazard rate tripled in Year 7 (0.8%/yr -> 2.4%/yr), its 3-year remaining-lifetime PD (~7.0%) is numerically smaller than its original 10-year Day-0 Lifetime PD (8.0%) simply because 7 years of time rolled off! - IFRS 9.B5.5.11 Rule: Never compare
PD_Remaining(7 -> 10 | Info_t=7)againstPD_Full(0 -> 10 | Info_t=0)! You MUST comparePD_Remaining(7 -> 10 | Info_t=7)against the conditional forward survival-adjustedPD_Orig_Forward(7 -> 10 | Info_t=0)(~2.4%)—instantly catching the7.0% / 2.4% = 2.92xrelative surge!
Why Pure Relative Ratios (2.0x) Fail at Both Ultra-Low and High PDs: The Hybrid Threshold Formula#
Testing a flat Relative Ratio >= 2.0x (100% PD increase) alone breaks down at both ends of the credit spectrum across BNP Paribas, Bank of Montreal, and ANZ Bank:
- Ultra-Prime Noise Trap (
PD = 3 bps -> 7 bps): If an AA corporate’s remaining PD ticks from0.03%(3 bps) to0.07%(7 bps), the relative ratio is2.33x(> 2.0x)—falsely dumping a pristineAA-borrower into Stage 2 on micro market noise! - Sub-Prime Insensitivity Trap (
PD = 12.0% -> 22.0%): Conversely, if a high-yield B-rated borrower deteriorates by+1,000 bpsfrom12.0%to22.0%PD, its relative ratio is only1.83x(< 2.0x)—missing a massive+10 percentage pointcredit plunge!
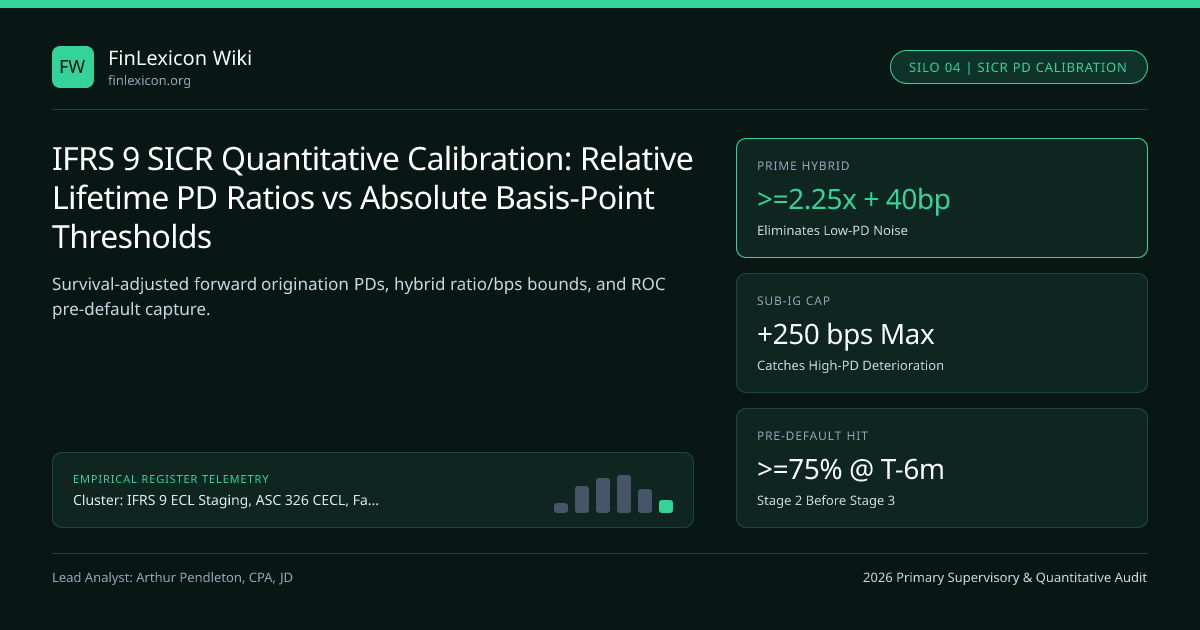
Institutional Hybrid SICR Standard: Quants pair a Grade-Stratified Relative Ratio (R_trigger) with an Additive Minimum Basis-Point Floor AND an Absolute PD Surge Cap: SICR_Quant <=> ( PD_Rem_t / PD_Rem_0 >= R_grade AND PD_Rem_t - PD_Rem_0 >= Floor_bps ) OR ( PD_Rem_t - PD_Rem_0 >= Cap_bps ) (e.g., require >= 2.0x–2.5x AND >= +30 to +50 bps change on low-PD grades, OR any absolute jump >= +200 to +300 bps annualized on sub-IG grades! Note: IASB / EBA prohibit using an Absolute Bps trigger ALONE* without relative calibration!)*
Three-Layer SICR Waterfall: Quantitative PD + Qualitative Watchlist + 30-DPD Backstop#
Audit-grade Stage 1/2/3 engines layer three complementary gates:
- Layer 1 — Quantitative Forward-Looking PD Test (accounts for 75%–85% of timely Stage 2 inflows).
- Layer 2 — Qualitative Early-Warning Triggers: Inclusion on Credit Risk Watchlist / Early Warning List, Performing Forbearance / Restructuring, adverse sector/geopolitical Collective Assessment transfer (ECB "Stage 2 collective sector overlays"), or LTV breach.
- Layer 3 — 30 Days Past Due (
30 DPD) Backstop: Catches the residual<5%–10%of unmodeled retail/SME delinquencies.
| Origination Rating Band | Annualized Orig. PD | Naive 2.0x Ratio Trigger | Calibrated Hybrid SICR Trigger | Why Hybrid Beats Naive 2.0x |
|---|---|---|---|---|
Ultra-Prime (AAA to AA-) | 0.03% (3 bps) | 0.06% (+3 bps noise!) | Low Credit Risk expedient OR >= 3.0x + +35 bps (0.38%) | Prevents false Stage 2 flips on AA bonds |
Investment Grade (A+ to BBB-) | 0.25% (25 bps) | 0.50% (+25 bps) | >= 2.25x AND >= +40 bps (~0.65% — BB+ cliff) | Aligns SICR with fallen-angel migration |
Crossover / SME (BB+ to BB-) | 1.50% (150 bps) | 3.00% (+150 bps) | >= 1.80x (2.70%) OR +200 bps annualized | Smoothly tightens multiplier as base PD rises |
Sub-Investment Grade (B+ to B-) | 6.50% (650 bps) | 13.00% (+650 bps too late!) | >= 1.40x OR +250 bps (9.00%) | Catches +250 bps surge long before 13%! |
Backtesting SICR Discrimination: Type I vs Type II Error & Pre-Default Capture Rate#
Model validation teams (under SR 11-7 / ECB TRIM / ISA 540 audit rules) optimize SICR cutoffs by measuring the Default Prior-to-Stage-3 Capture Rate: what percentage of loans entering Stage 3 Default in Year T were already flagged in Stage 2 at least 6 to 12 months prior (Target >= 70%–80%), balanced against the False-Positive Cure Rate (Type I Error)!
Using 12-Month PD as a Permissible Proxy (IFRS 9.B5.5.13)#
IFRS 9.B5.5.13 allows testing PD_12m changes as a proxy for PD_Lifetime only for non-back-loaded amortizing loans where empirical validation proves 12m and Lifetime term structures move monotonically across the IFRS 9, CECL & Fair Value Accounting topic hub.
- AnnualizedPD(t -> T) = 1 - ( 1 - PDRemaining(t -> T) )^( 1 / (T - t) )
- SICRFlag = I( PDRemt / PDOrigForward >= R(PD0) AND DeltaAnnPD >= 0.0040 ) OR I( DeltaAnnPD >= 0.0250 )
- Worked Age-Seasoning Audit (10Y Mortgage Originated at t=0 w/ CumPD0(0->10) = 6.00% and CumPD0(0->6) = 4.10%; Evaluated at Year t=6):
- 1. Conditional Forward Origination PD for Years 6->10 = (0.0600 - 0.0410) / (1 - 0.0410) = 0.0190 / 0.9590 = 1.981% (0.499%/yr)
- 2. At Year 6, Macro Unemployment Rises -> Current Remaining 4-Year PD_t(6->10) = 4.850% (1.235%/yr => +73.6 bps annualized)
- 3. Naive Unadjusted Test (Wrong!): 4.85% < 6.00% Original 10Y PD (Misses SICR!)
- 4. True Conditional Forward Test: Ratio = 4.850% / 1.981% = 2.45x (>= 2.25x) & +73.6 bps (>= +40 bps) -> Triggers Stage 2 SICR!
Frequently asked questions
Why did the ECB criticize banks whose Stage 2 transfers relied heavily on the 30-DPD backstop or single-notch rating downgrades?
Waiting for 30 DPD violates IFRS 9’s forward-looking core, and requiring e.g. a "3-notch internal rating downgrade" on a Through-the-Cycle (TTC) rating scale fails to capture macroeconomic Point-in-Time (PiT) PD surges when TTC ratings stay intentionally stable through recessions!
How does IFRS 9 handle revolving credit facilities (credit cards / overdrafts) that have no fixed origination date or maturity?
For revolving facilities under IFRS 9.5.5.20, banks calibrate behavioral lifetime horizons (3–7 years) and anchor origination PD to either the initial credit-line underwriting date or the most recent substantive substantive re-underwriting / credit review event.
What is a "Collective Sector Stage 2 Transfer" when borrower-level financials lag?
Under IFRS 9.B5.5.4, when an energy shock, tariff shock, or commercial-real-estate rate spike hits a borrower cohort *before* individual annual SME financial statements update, banks must migrate the exposed high-leverage sub-sector slice into Stage 2 collectively rather than waiting 12 months for lagging borrower financials!
If a loan’s PD rises solely because risk-free market interest rates rose on a floating-rate loan, is that SICR?
Yes, if higher floating debt-service payments materially increase the borrower’s probability of defaulting (IFRS 9.B5.5.17)! Even if the bank’s contractual spread over SOFR didn’t change, floating-rate shock erosion of Interest Coverage Ratios (ICR < 1.25x) directly raises PD_Rem_t and triggers SICR!
Publication record
- Published
- 14 November 2026
- Updated
- 15 November 2026
- Author
- Arthur Pendleton, CPA, JD
- Review
- Review not recorded
- Automated fact check
- Passed in the stored pipeline record
- Source URLs
- 3 recorded
AI assistance recorded: anthropic/claude-opus-4.6. This field does not establish human review or source verification.
Academic & Institutional Attribution
Cite This Research & Embed Live Data Card
Standard academic & institutional research paper citation format.
Arthur Pendleton, CPA, JD. (2026, November 14). IFRS 9 SICR Quantitative Calibration: Relative Lifetime PD Ratios vs Absolute Basis-Point Thresholds. FinLexicon Wiki. https://finlexicon.org/wiki/sicr-quantitative-pd-thresholds-relative-vs-absolute-triggersRelated Ifrs9 Cecl Credit Provisioning & Institutional Briefings
Explore Ifrs9 Cecl Credit Provisioning Hub (20) →Ifrs9 Cecl Credit Provisioning
IFRS 9 Expected Credit Loss, US GAAP ASC 326 CECL, Fair Value Hierarchy & Hedge Accounting GuideIfrs9 Cecl Credit Provisioning
IFRS 9 SPPI Cash-Flow Test & May 2024 IASB Amendments: ESG Sustainability-Linked Loans & Non-Recourse DebtIfrs9 Cecl Credit Provisioning
POCI (IFRS 9) vs PCD (US GAAP ASC 326): Purchased Credit-Impaired Accounting, Gross-Up & CAEIRIfrs9 Cecl Credit Provisioning
IFRS 13 & US GAAP ASC 820 Fair Value Hierarchy: Exit Price, Principal Market & Level 1 / 2 / 3 TransfersIfrs9 Cecl Credit Provisioning
Prudent Valuation Adjustment (PVA / AVA — EU CRR Art. 105 & Basel CAP50): 90% Confidence CET1 DeductionsIfrs9 Cecl Credit Provisioning
xVA Valuation Adjustments (CVA, DVA, FVA, KVA & MVA): IFRS 13 / ASC 820 Accounting vs Basel MAR50 CapitalIfrs9 Cecl Credit Provisioning
Own-Credit Risk on Fair-Value Option Liabilities (IFRS 9.5.7.7 & ASC 825-10): OCI & Basel CET1 FiltersIfrs9 Cecl Credit Provisioning
IFRS 9 General Hedge Accounting vs US GAAP ASC 815: Rebalancing, Cost of Hedging OCI & Effectiveness RulesCentral Clearing Ccp Waterfall
Variation Margin Gains Haircutting (VMGH), Partial Tear-Up & End-of-Waterfall CCP Recovery ToolsCentral Clearing Ccp Waterfall
Client Clearing Segregation: US CFTC Part 22 LSOC vs EU EMIR Article 39 Omnibus (OSA) & Individual (ISA)Central Clearing Ccp Waterfall
SEC Rule 17Ad-22(e)(18) U.S. Treasury Cash & Repo Central Clearing Mandate: Scope, Deadlines & FICC ImpactCentral Clearing Ccp Waterfall
FICC Sponsored Member Repo: Done-With vs Done-Away Execution, ASC 210-20 Netting & SLR Relief
FinLexicon Wiki Data, Benchmarks & Contributor Records
CC BY 4.0 Open Data
Open Institutional Datasets (CSV / JSON) →
Download desk-compiled quantitative series & schemas.
2026 Reference Matrix
2026 Institutional Benchmarks & Thresholds →
Statutory capital, clearing, margin & rate conventions.
Editorial Records
Authors & Review Records →
View named contributors where those records are available.
Complete Index
Master Research & Dossier Archive →
Browse all published briefings by topic pillar & date.