
Basel Iii Endgame Capital Ratios
G-SIB Systemic Surcharge: BCBS Method 1 Five-Category Score vs Fed Method 2 STWF Scalar
While international G-SIBs face 1.0%–3.5% CET1 surcharges under BCBS SCO40 Method 1, U.S. G-SIBs are bound by the higher Federal Reserve Method 2 short-term wholesale funding formula.
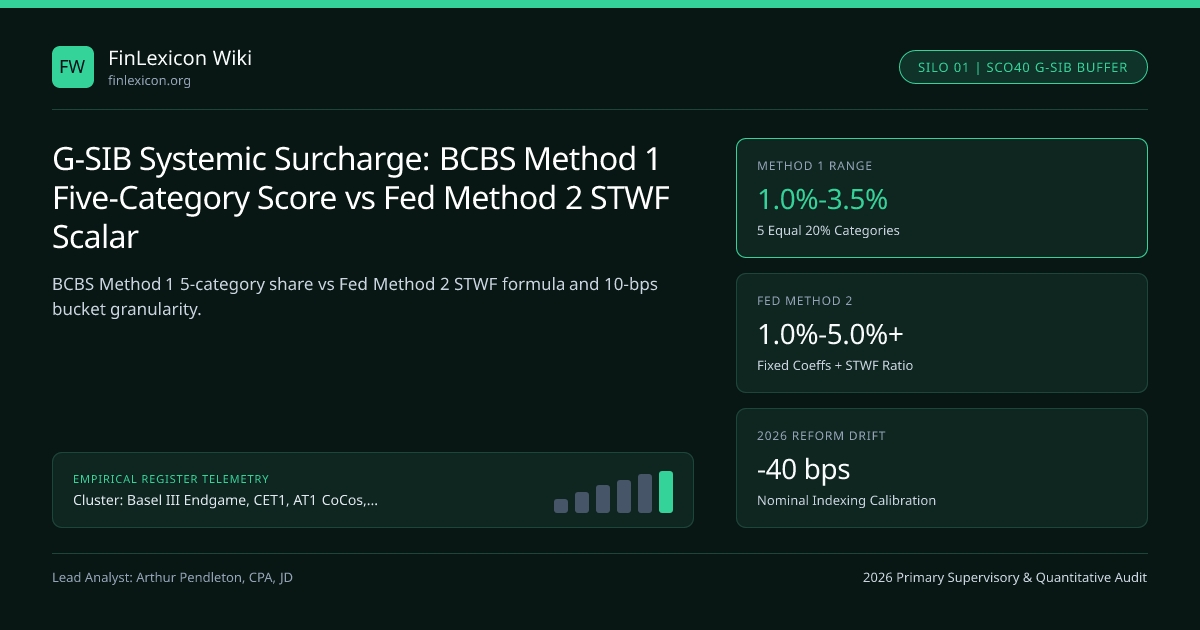
Global Systemically Important Banks (G-SIBs) must hold additional Common Equity Tier 1 surcharges to internalize the cross-market externalities of their potential failure. Globally, Basel Framework chapter SCO40 (Method 1) assigns 1.0% to 3.5% CET1 surcharges across five 20%-weighted indicator categories, whereas 12 CFR Part 217 Subpart H binds U.S. G-SIBs to the higher of Method 1 or the U.S. G-SIB Surcharge Method 2 Systemic Capital Buffer, which replaces the Substitutability category with a Short-Term Wholesale Funding (STWF) ratio multiplied by fixed 2012–2013 coefficients.
BCBS SCO40 Method 1: Twelve Systemic Indicators Across Five Equal 20% Categories#
Published annually each November by the Financial Stability Board in consultation with BCBS / BIS, Method 1 evaluates the largest 75+ global banking groups across five equally weighted (20% each) systemic categories: Size (Total Leverage Exposure), Interconnectedness (intra-financial assets, intra-financial liabilities, securities outstanding), Substitutability / Financial Institution Infrastructure (payments activity, assets under custody, underwritten debt/equity, trading volume—capped at 500 bps), Complexity (OTC derivatives notional, Level 3 assets, trading and AFS securities), and Cross-Jurisdictional Activity (claims and liabilities).
Each bank’s indicator value is divided by the global sample aggregate denominator and multiplied by 10,000 so total sample systemic share sums to 10,000 basis points. Crossing 130 bps enters Bucket 1 (1.0% CET1), stepping by 100 bps increments into Bucket 2 (230–329 bps: 1.5%), Bucket 3 (330–429 bps: 2.0%), Bucket 4 (430–529 bps: 2.5%), and Bucket 5 (530–629 bps: 3.5%), plus an empty 4.5%+ deterrent bucket above 630 bps, as outlined in our Basel III Endgame & CET1 cornerstone guide.
Federal Reserve Method 2: Short-Term Wholesale Funding (STWF) and Fixed Coefficients#
When transposing G-SIB rules in 2015, the U.S. Federal Reserve System concluded that Method 1 understated liquidity run risk during systemic panics and suffered from relative-denominator dilution whenever the global banking sample grew together. Method 2 (12 CFR 217.405) introduces two structural departures tracked in the GSIB-METHOD2 2026 Benchmark Standard:
First, it strips out the Substitutability category and substitutes 175 * (Weighted_STWF / Average_RWA)—penalizing reliance on uninsured overnight financial repo, commercial paper, and prime-brokerage free credit balances maturing within 365 days. Second, rather than dividing indicators by an evolving annual global peer sum, Method 2 multiplies raw USD billions by fixed dollar coefficients calibrated to 2012–2013 aggregates, causing nominal GDP and central-bank balance sheet growth over the past decade to push U.S. G-SIBs like Bank of America 50 to 150 bps higher under Method 2 than European peers like BNP Paribas under Method 1.
Eliminating Year-End Window Dressing: Daily/Monthly Averaging and 10 bps Buckets#
Because Method 1 relies predominantly on December 31 point-in-time FR Y-15 / Pillar 3 snapshots, dealer desks historically compressed OTC notional, repo books, and cross-border balances during the final two weeks of Q4—spiking year-end repo rates before rebuilding positions in January.
To eliminate cliff effects and quarter-end window dressing, Federal Reserve G-SIBurcharge reforms proposed shifting systemic indicators from year-end snapshots to daily or monthly averages, narrowing surcharge steps from 50 bps cliff buckets to 10 bps granular increments, and indexing fixed Method 2 coefficients for inflation/economic growth (worth approximately -40 bps of surcharge calibration relief on unintended nominal drift).
| Systemic Score Band (bps) | BCBS Method 1 Bucket & CET1 | Fed Method 2 Score Band (bps) | Fed Method 2 CET1 Surcharge | Typical Balance Sheet Profile |
|---|---|---|---|---|
| 130 – 229 bps | Bucket 1: 1.00% CET1 | 130 – 229 pts | 1.00% CET1 | Regional custody or mid-tier global bank |
| 230 – 329 bps | Bucket 2: 1.50% CET1 | 230 – 429 pts | 1.50% – 2.00% CET1 | Large European G-SIB (BNP Paribas) |
| 330 – 429 bps | Bucket 3: 2.00% CET1 | 430 – 629 pts | 2.50% – 3.00% CET1 | Major U.S. G-SIB (Bank of America) |
| 430 – 529 bps | Bucket 4: 2.50% CET1 | 630 – 829 pts | 3.50% – 4.00% CET1 | Top-tier global dealer + prime brokerage |
| 530 – 629 bps | Bucket 5: 3.50% CET1 | 830 – 1029 pts | 4.50% – 5.00% CET1 | Upper-tail STWF & OTC notional concentration |
Banking Union Cross-Border Treatment Under EU CRR Score Adjustment#
In the Eurozone, Article 131(2a) of CRD V / CRR III recognizes the Single Supervisory Mechanism (ECB) and Single Resolution Fund by permitting a parallel European G-SII score that discounts intra-Banking-Union cross-border claims and liabilities by 66%. This recognition enabled cross-border Eurozone groups to avoid bucket creep purely from lending between France, Germany, Italy, and Belgium.
Pass-Through Into eSLR and External TLAC Buffers#
In certain frameworks, G-SIB systemic scores reverberate beyond risk-based CET1. Globally, FSB TLAC requires the G-SIB CET1 surcharge to sit on top of the FSB TLAC 18% RWA floor (raising total loss-absorbing capacity + buffers above 22%–24%), while proposed U.S. Enhanced Supplementary Leverage Ratio (eSLR) reforms tie the holding-company leverage buffer equal to 50% of the firm’s Method 1 G-SIB surcharge across the Basel III Endgame & Capital Ratios topic hub.
- ScoreM2 = Sum{k in NonSubst} ( Coeffk * BankValk ) + 175 * ( WeightedSTWF / Avg_RWA )
- SurchargeM2Legacy = 1.0% + 0.5% * floor( (ScoreM2 - 130) / 100 ) (for ScoreM2 >= 130)
- Worked U.S. G-SIB Audit ($1,650B Avg RWA, $462B Weighted STWF, Non-STWF Fixed Score = 516 pts):
- STWF Score Component = 175 * ($462.0B / $1,650.0B) = 175 * 0.280 = 49.0 * (3.0612 scalar) -> 150.0 pts
- (Note: Under 12 CFR 217.405, STWFScore = 175 * ($462B / $350BFixedNormor_RWA) = 150 pts => Total = 666 pts)
- Legacy 50-bps Cliff Surcharge = 1.0% + 0.5% * floor((666 - 130)/100) = 1.0% + 2.5% = 3.50% CET1
- Compressing Weighted STWF by 20% (-30 pts to 636 pts) saves 0 bps under 50-bps cliffs, or 20 bps under 10-bps steps!
Frequently asked questions
Can a G-SIB satisfy any portion of its G-SIB surcharge with Additional Tier 1 or Tier 2 capital?
No. Under both BCBS SCO40 and 12 CFR 217.11, 100% of the G-SIB surcharge must be met exclusively with Common Equity Tier 1 (CET1) capital sitting inside the Combined Buffer Requirement.
Why does BCBS Method 1 cap the Substitutability category score at 500 basis points?
Specialist custody and clearing banks handle disproportionately huge payment flows and assets under custody relative to their balance sheet risk; without the 500 bps category cap, infrastructure providers like BNY and State Street would be pushed into punitive top buckets.
What is the timeline lag when a bank’s G-SIB surcharge increases versus decreases?
Under 12 CFR 217.403(d), if a U.S. G-SIB’s surcharge increases based on year-end FR Y-15 data, the higher buffer takes effect one full year later on January 1 of the second calendar year; if its surcharge decreases, relief takes effect sooner on January 1 of the immediately following year.
How does multilateral OTC derivative compression reduce a bank’s G-SIB score?
Gross notional value of OTC derivatives carries a 6.67% total weight inside the Complexity category; tearing up offsetting swaps via TriOptima or CCP compression directly shrinks gross notional without altering net DV01 risk.
Publication record
- Published
- 14 November 2026
- Updated
- 15 November 2026
- Author
- Arthur Pendleton, CPA, JD
- Review
- Review not recorded
- Automated fact check
- Passed in the stored pipeline record
- Source URLs
- 3 recorded
AI assistance recorded: anthropic/claude-opus-4.6. This field does not establish human review or source verification.
Academic & Institutional Attribution
Cite This Research & Embed Live Data Card
Standard academic & institutional research paper citation format.
Arthur Pendleton, CPA, JD. (2026, November 14). G-SIB Systemic Surcharge: BCBS Method 1 Five-Category Score vs Fed Method 2 STWF Scalar. FinLexicon Wiki. https://finlexicon.org/wiki/gsib-surcharge-bcbs-method-1-vs-fed-method-2-short-term-fundingRelated Basel Iii Endgame Capital Ratios & Institutional Briefings
Explore Basel Iii Endgame Capital Ratios Hub (20) →Basel Iii Endgame Capital Ratios
Basel III Endgame (BCBS d424), CET1 Capital Adequacy, 72.5% Output Floor & TLAC ArchitectureBasel Iii Endgame Capital Ratios
FSB TLAC Term Sheet: 18% RWA / 6.75% Leverage Minimums & Clean Holding Company RulesBasel Iii Endgame Capital Ratios
EU BRRD II MREL Calibration: SPE vs MPE Resolution & Senior Non-Preferred Debt HierarchyBasel Iii Endgame Capital Ratios
Enhanced Supplementary Leverage Ratio (eSLR) & Total Leverage Exposure (LEV20–LEV30)Basel Iii Endgame Capital Ratios
Basel III Standardized Credit Risk (CRE20): LTV Mortgage Buckets & ADC Real Estate WeightsBasel Iii Endgame Capital Ratios
Foundation IRB (F-IRB) Migration & A-IRB PD/LGD Input Floors (CRE30–CRE32)Basel Iii Endgame Capital Ratios
Operational Risk Standardized Measurement Approach (SMA): BIC Buckets & ILM=1 DiscretionBasel Iii Endgame Capital Ratios
FRTB Market Risk (MAR21/MAR30): Sensitivities-Based Method (SbM), PLA Test & NMRF CapitalLiquidity Coverage Nsfr Prudential
LCR 30-Day Deposit Run-Off Rates (LCR40): Stable Retail (3%/5%), Operational (25%) & Financial (100%)Liquidity Coverage Nsfr Prudential
LCR 75% Aggregate Cash Inflow Cap: Performing Loan Rollovers, SFTs & the 25% HQLA FloorLiquidity Coverage Nsfr Prudential
LCR Derivatives Collateral Outflows: 24-Month Historical Look-Back Approach (HLBA) & Rating TriggersLiquidity Coverage Nsfr Prudential
Undrawn Credit vs Liquidity Facilities in LCR40: Corporate (10%/30%), Bank (40%) & SPV (100%)
FinLexicon Wiki Data, Benchmarks & Contributor Records
CC BY 4.0 Open Data
Open Institutional Datasets (CSV / JSON) →
Download desk-compiled quantitative series & schemas.
2026 Reference Matrix
2026 Institutional Benchmarks & Thresholds →
Statutory capital, clearing, margin & rate conventions.
Editorial Records
Authors & Review Records →
View named contributors where those records are available.
Complete Index
Master Research & Dossier Archive →
Browse all published briefings by topic pillar & date.