
Basel Iii Endgame Capital Ratios
Operational Risk Standardized Measurement Approach (SMA): BIC Buckets & ILM=1 Discretion
Basel OPE25 replaces internal operational risk AMA models with the Standardized Measurement Approach (SMA), combining marginal 12%/15%/18% Business Indicator buckets with an Internal Loss Multiplier.
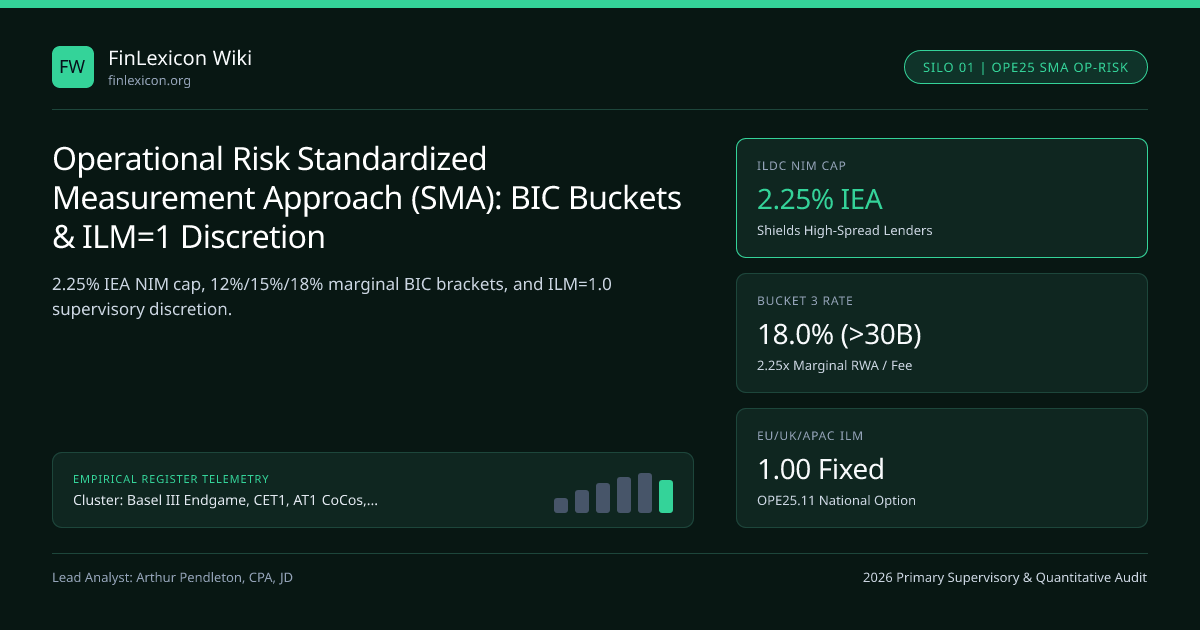
During the 2008 crisis and subsequent conduct-litigation wave, Basel II Advanced Measurement Approach (AMA) internal operational risk models produced wildly inconsistent capital charges across banks facing identical cyber, fraud, and legal exposures. Basel Framework chapter OPE25 retires AMA, Standardized, and Basic Indicator approaches in favor of a single Standardized Measurement Approach (SMA), setting Operational Risk Capital equal to BIC * ILM (and RWA_Op = 12.5 * ORC).
Three-Year Business Indicator (BI): ILDC + SC + FC Accounting Components#
Rather than using raw gross income—which penalized banks when net interest margins compressed or distorted fee pass-throughs—OPE10 defines the Business Indicator (BI) as the sum of three three-year rolling averages explained in our Basel III Endgame & CET1 cornerstone guide:
- Interest, Leases, and Dividend Component (ILDC):
min( Avg |Interest_Income - Interest_Expense| , 2.25% * Avg Interest_Earning_Assets ) + Avg Dividend_Income. Capping net interest margin at 2.25% of interest-earning assets prevents high-margin emerging-market or consumer-card lenders from suffering disproportionate operational risk surcharges for credit spread compensation! - Services Component (SC):
max( Avg Other_Operating_Income , Avg Other_Operating_Expense ) + max( Avg Fee_Income , Avg Fee_Expense ). Takingmax(Fee_Income, Fee_Expense)rather than net fee income heavily penalizes custody, wealth-management, and card-network banks like American Express or Berenberg Bank that pay high interchange/distribution rebates. - Financial Component (FC):
Avg |Net_P&L_Trading_Book| + Avg |Net_P&L_Banking_Book|, using absolute annual values so trading losses increase rather than shrink operational risk capital!
Marginal Business Indicator Component (BIC) Coefficients: 12%, 15%, and 18%#
Once BI is computed in billions of euros (or local currency statutory equivalents), OPE25.7 applies progressive marginal tax-style brackets to derive the Business Indicator Component (BIC):
- Bucket 1 (
BI <= EUR 1.0B):12% * BI - Bucket 2 (
EUR 1.0B < BI <= EUR 30.0B):EUR 0.12B + 15% * (BI - EUR 1.0B) - Bucket 3 (
BI > EUR 30.0B):EUR 4.47B + 18% * (BI - EUR 30.0B)
Because every G-SIB such as Bank of America or BNP Paribas generates a BI well above EUR 30 billion, each incremental dollar of gross fee or trading revenue attracts an 18% operational capital charge (225% marginal RWA per dollar of fee revenue when ILM = 1.0!).
The Logarithmic Internal Loss Multiplier (ILM) and Global Adoption of ILM = 1.0#
For Bucket 2 and Bucket 3 institutions (BI > EUR 1B), OPE25.8–OPE25.11 introduces a 10-year historical Loss Component (LC) equal to 15 * Average_Annual_Net_Operational_Losses (capturing events exceeding EUR 20,000, or EUR 100,000 at supervisory discretion). LC feeds into a concave logarithmic Internal Loss Multiplier: ILM = ln( exp(1) - 1 + (LC / BIC)^0.8 ).
Notice the pivot point: when LC == BIC, (LC/BIC)^0.8 = 1, yielding ln(e) = 1.00. If historical losses are zero, ILM floors at ln(e - 1) = 0.541. Crucially, footnote OPE25.11 permits national supervisors to set ILM = 1.0 for all banks so operational capital equals pure BIC. The European Union (CRR III), United Kingdom (UK PRA), MAS, HKMA, and APRA all adopted ILM = 1.0 (while U.S. ERBA proposed flooring ILM >= 1.0 before moving toward ILM = 1.0 alignment) to avoid penalizing banks indefinitely for resolved decade-old conduct settlements.
| Jurisdiction & Supervisor | ILM Calibration Choice | Loss Data Threshold | Impact on Fee-Heavy / Legacy-Litigation Banks | Pillar 2 Add-On Role |
|---|---|---|---|---|
| INTL Baseline (BCBS / BIS OPE25) | Full Logarithmic ILM (>EUR 1B) | EUR 20,000 (opt. EUR 100k) | ILM ranges 0.54x (clean) to >1.6x (high loss) | Standard Pillar 2 oversight |
| European Union (ECB CRR III) | ILM fixed at 1.00 across EU | Loss tracking kept for disclosure | Eliminates legacy conduct cliff; SC fees still bite | SREP P2R captures tail op risk |
| United Kingdom (UK PRA) | ILM fixed at 1.00 in Pillar 1 | Supervisory loss reporting | Predictable BIC-only Pillar 1; Pillar 2A tailored | PRA Pillar 2A op-risk review |
| United States (Fed / OCC) | Floored >=1.0 (2023) / 1.0 recalib. | $20,000 / $100,000 reporting | Major focus on SC fee gross-up for card/wealth | CCAR op-risk stress interaction |
| Singapore (MAS) & Australia (APRA) | ILM fixed at 1.00 (APS 115) | Supervisory operational governance | Clean BIC formula aligned w/ international peers | Targeted supervisory overlays |
Divestitures, Mergers, and Exclusion of Settled Discontinued-Business Losses#
Without adjustment, selling a high-loss retail brokerage unit would shrink BI within three years while leaving 10 years of legacy losses trapped inside LC. OPE25.18–OPE25.34 requires prior supervisory approval to exclude divested business indicators and allows removing historical operational loss events only when the divested risk exposure no longer exists anywhere in the group.
Why SMA Operational RWA Cannot Be Reduced by the 72.5% Output Floor#
Because SMA is the sole operational risk methodology in both Track A (modeled total) and Track B (standardized total) of the BCBS d424 72.5% RWA output floor, RWA_SMA enters modeled RWA at 100% and standardized RWA at 72.5%—meaning SMA expansion actually gives IRB banks slightly more standardized headroom against credit output-floor binding across the Basel III Endgame & Capital Ratios topic hub!
- BI = ILDC + [ max(AvgOOI, AvgOOE) + max(AvgFeeInc, AvgFeeExp) ] + [ Avg(|TradingPL|) + Avg(|BankingPL|) ]
- BIC = 0.12 * min(BI, 1B) + 0.15 * max(0, min(BI - 1B, 29B)) + 0.18 * max(0, BI - 30B)
- ILM = ln( exp(1) - 1 + ( (15 * Avg10YLoss) / BIC )^0.8 ) | RWA_SMA = 12.5 * BIC * ILM
- Worked G-SIB Audit (IEA = EUR 1,100B, Net Int = EUR 28.0B, Gross Fee Inc = EUR 16.5B, FC = EUR 3.75B, 10Y Avg Loss = EUR 0.80B):
- ILDC = min(EUR 28.0B, 0.0225 * EUR 1,100B) = EUR 24.75B (2.25% NIM cap saves EUR 3.25B of BI!)
- BI = EUR 24.75B + EUR 16.50B + EUR 3.75B = EUR 45.00B
- BIC = 0.12(1.0) + 0.15(29.0) + 0.18*(15.0) = 0.12 + 4.35 + 2.70 = EUR 7.170B
- Under EU/UK ILM = 1.0: RWA_SMA = 12.5 * EUR 7.170B = EUR 89.625B
- Under Full BCBS ILM (LC = 15 * 0.80B = EUR 12.0B): ILM = ln(1.71828 + (12.0/7.17)^0.8) = ln(3.228) = 1.1719 => RWA = EUR 105.03B
Frequently asked questions
Why does the ILDC cap Net Interest Income at 2.25% of Interest-Earning Assets?
High net interest margins typically compensate lenders for higher borrower default risk—which is already capitalized inside credit RWA—not proportionally higher operational error risk; the 2.25% IEA cap prevents double-taxing high-NIM consumer and emerging-market banks.
Why did the original 2023 U.S. proposal floor ILM at 1.0 instead of letting low-loss banks drop below 1.0?
Under full BCBS OPE25, a bank with LC < BIC achieves an ILM between 0.541 and 0.999; U.S. agencies initially proposed flooring ILM >= 1.0 so clean history could never reduce BIC while high losses still raised ILM, before industry feedback pushed toward fixing ILM = 1.0.
Are insurance claims or credit-linked operational losses included in the 10-year Loss Component?
Operational losses linked to credit risk that have already been reflected in credit RWA are excluded from the operational Loss Component to prevent double-counting, whereas boundary fraud events on market/trading desks remain included inside operational losses.
Can insurance recoveries reduce historical operational loss events in SMA?
Yes, under OPE25.24, operational losses are recorded net of direct recoveries (including verified cash insurance payouts received from unaffiliated third-party insurers), once payment has actually been received or is legally virtually certain.
Publication record
- Published
- 14 November 2026
- Updated
- 16 November 2026
- Author
- Arthur Pendleton, CPA, JD
- Review
- Review not recorded
- Automated fact check
- Passed in the stored pipeline record
- Source URLs
- 3 recorded
AI assistance recorded: anthropic/claude-opus-4.6. This field does not establish human review or source verification.
Academic & Institutional Attribution
Cite This Research & Embed Live Data Card
Standard academic & institutional research paper citation format.
Arthur Pendleton, CPA, JD. (2026, November 16). Operational Risk Standardized Measurement Approach (SMA): BIC Buckets & ILM=1 Discretion. FinLexicon Wiki. https://finlexicon.org/wiki/sma-standardized-measurement-approach-operational-risk-ilmRelated Basel Iii Endgame Capital Ratios & Institutional Briefings
Explore Basel Iii Endgame Capital Ratios Hub (20) →Basel Iii Endgame Capital Ratios
Basel III Endgame (BCBS d424), CET1 Capital Adequacy, 72.5% Output Floor & TLAC ArchitectureBasel Iii Endgame Capital Ratios
FRTB Market Risk (MAR21/MAR30): Sensitivities-Based Method (SbM), PLA Test & NMRF CapitalBasel Iii Endgame Capital Ratios
Maximum Distributable Amount (MDA): CET1 Buffer Quartiles & AT1 Coupon RestrictionsBasel Iii Endgame Capital Ratios
Standardized Credit Risk Assessment (SCRA): Grade A, B & C Interbank Risk Weights (CRE20)Basel Iii Endgame Capital Ratios
U.S. Stress Capital Buffer (SCB): CCAR Nine-Quarter PPNR & Peak CET1 Drawdown MechanicsBasel Iii Endgame Capital Ratios
ECB SREP Pillar 2 Requirement (P2R) vs Pillar 2 Guidance (P2G) & UK PRA Pillar 2A/2BBasel Iii Endgame Capital Ratios
Basel CRE22 Credit Risk Mitigation: Comprehensive Haircuts, Repo VaR Removal & GuaranteesBasel Iii Endgame Capital Ratios
Basel III Securitization Framework (SEC10–SEC40): STC Criteria, p-Parameter & Senior FloorsLiquidity Coverage Nsfr Prudential
IRRBB Standards (BCBS d368 / SRP31): Six EVE Shock Scenarios, 15% Tier 1 Outlier Test & Delta-NIILiquidity Coverage Nsfr Prudential
Non-Maturity Deposits (NMD) Behavioral Modeling: Deposit Betas, Core Caps & SRP31 Duration CeilingsLiquidity Coverage Nsfr Prudential
U.S. Regulation WW (12 CFR Part 249): Peak-Day Maturity Mismatch Add-On & Tailoring Categories I–IVLiquidity Coverage Nsfr Prudential
Supervisory ILAAP, Internal Liquidity Stress Testing (Reg YY) & Reverse Stress Survival Horizons
FinLexicon Wiki Data, Benchmarks & Contributor Records
CC BY 4.0 Open Data
Open Institutional Datasets (CSV / JSON) →
Download desk-compiled quantitative series & schemas.
2026 Reference Matrix
2026 Institutional Benchmarks & Thresholds →
Statutory capital, clearing, margin & rate conventions.
Editorial Records
Authors & Review Records →
View named contributors where those records are available.
Complete Index
Master Research & Dossier Archive →
Browse all published briefings by topic pillar & date.