
Ifrs9 Cecl Credit Provisioning
Multi-Scenario Macroeconomic Weighting & Post-Model Adjustments (PMAs / Overlays) in IFRS 9 & CECL
Expected Credit Loss is a strictly convex function of GDP, unemployment, and commercial property prices—meaning evaluating ECL solely at the Baseline forecast systematically understates reserves and requires probability-weighted scenarios plus governed Post-Model Adjustments (PMAs).
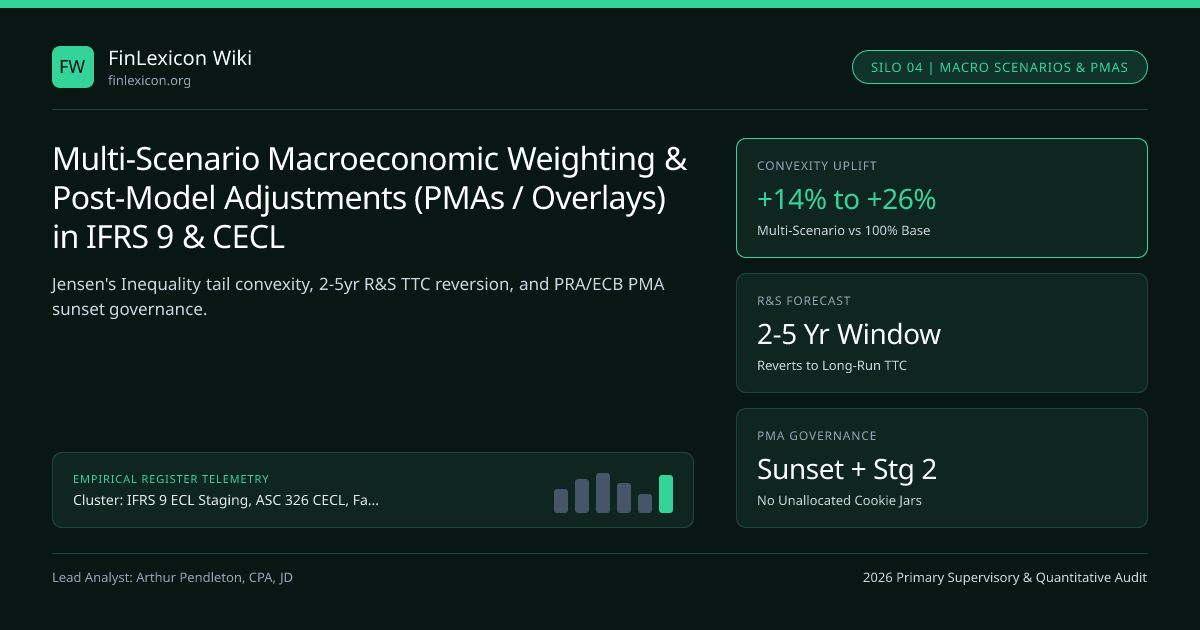
Why does IFRS 9 paragraph 5.5.17(a) explicitly mandate an "unbiased and probability-weighted amount that is determined by evaluating a range of possible outcomes"—making it illegal under IFRS 9 to run your credit loss engine on a single consensus Baseline GDP forecast? Because of Jensen’s Inequality (E[f(X)] > f(E[X]))! Credit losses explode convexly in recessions: a -3% GDP recession triples defaults AND slashes collateral recovery (PD * LGD double-hit) AND pushes 25% of the book across the Stage 2 SICR cliff—whereas a +3% GDP boom can never reduce losses below 0%!
Proving Nonlinear Convexity: Why 50% Base + 30% Downside + 20% Upside Beats 100% Base by +12%–25%#
At Bank of America, BNP Paribas, Bank of Montreal, and ANZ Bank, macro-econometric satellite models (Merton-Vasicek Z-score transformations) translate quarterly paths of Unemployment, Real GDP, Policy Rates, House Price Index (HPI), and CRE Price Index into Point-in-Time (PiT) PD(t) and LGD(t) vectors, anchored in our IFRS 9, CECL & Fair Value cornerstone guide.
Three compounding nonlinearities make ECL(Scenario) sharply convex:
- Probit / Logit PD Tail Curvature: Going from
4%to6%unemployment lifts corporate PDs from0.6%to1.4%(+0.8%), whereas going from6%to8%unemployment jumps PDs from1.4%to4.2%(+2.8%!). - Correlated PD-LGD Co-Movement: At the exact moment mortgage defaults triple, HPI drops
-20%, pushing LTVs above100%and multiplyingLGD(3.0x PD * 2.2x LGD = 6.6x ECL!). - Endogenous IFRS 9 Stage 2 Migration Inside Each Scenario: Under ITG (
IFRS Transition Resource Group) guidance, staging must be evaluated separately inside each macro scenario (or probability-weighted across scenarios)—so in the Severe Downside scenario (10%–15%weight),$80Bof loans migrate from12-month Stage 1toLifetime Stage 2, adding massive cliff convexity!
Reasonable and Supportable (R&S) Forecast Horizon (2–5 Years) & Mean Reversion (ASC 326 vs IFRS 9)#
Nobody can forecast quarterly unemployment reliably in Year 18 of a 30-year mortgage! Both IFRS 9.5.5.17(c) and US GAAP ASC 326-20-30-9 divide the lifetime timeline into two segments:
- Active Reasonable & Supportable (
R&S) Macro Horizon (Typically 2 to 3 yearsat U.S. G-SIBs;3 to 5 yearsat EU/UK/Canadian banks): Driven directly by the bank’s multi-scenario Chief Economist forecasts. - Long-Run Historical Reversion (
Years 4..30): Once beyond theR&Shorizon (where macro forecasts lose statistical skill),PDandLGDrevert (straight-line,exponential, orimmediate step) to long-run Through-the-Cycle (TTC) historical averages!
Governing Post-Model Adjustments (PMAs / Management Overlays): UK PRA & ECB Strict Lifecycle Rules#
During COVID-19 (2020–2021), 2022–2023 inflation/energy shocks, and 2024–2026 tariff/geopolitical & office-CRE stress, historical statistical models trained on 2010–2019 data failed (government stimulus artificially depressed 2020 bankruptcies while rates later surged +500 bps!). Banks booked Post-Model Adjustments (PMAs / In-Model Adjustments / Qualitative Overlays) representing 15%–35% of total Stage 1+2 allowances!
Supervisors led by the UK PRA (SS1/23 Model Risk Management), ECB, and OCC enforce four hard PMA Governance Guardrails:
- Specific Risk Gap: Every PMA must target a documented model limitation or novel risk (
never an unallocated "rainy-day cookie-jar" general reserve!). - Stage-Level Allocation: A macro PMA cannot just sit as a top-side lump sum—if it implies higher credit risk, a consistent slice of loans must also migrate into Stage 2 (
IFRS 7disclosure!). - Sunset / Retirement Date: Every PMA must carry an explicit sunset date (
typically <= 12–24 months) to be absorbed into recalibrated core models or retired. - Audit Committee & External Audit Sign-Off: Tested rigorously for directional bias under ISA 540 / PCAOB AS 2501.
Macroeconomic Scenario (Example UK/EU G-SIB) | Assigned Probability Weight (w_s) | Peak Unemployment / HPI Trough | Scenario-Specific Stage 2 Share | 100%-Weighted Portfolio ECL ($M) | Weighted Contribution (w_s * ECL_s) |
|---|---|---|---|---|---|
| Upside Expansion | 15% | 3.8% Unemp / +6.0% HPI | 6.5% in Stage 2 | $3,400M | $510M |
| Baseline Consensus | 50% | 4.6% Unemp / +1.5% HPI | 10.2% in Stage 2 | $4,200M | $2,100M |
| Moderate Recession | 25% | 6.8% Unemp / -11.0% HPI | 19.5% in Stage 2 | $6,400M | $1,600M |
| Severe Stagflation Tail | 10% | 9.2% Unemp / -24.0% HPI | 31.0% in Stage 2 | $10,900M | $1,090M |
US GAAP CECL Qualitative (Q-Factor) Reserves vs IFRS 9 PMAs#
In the United States, ASC 326-20-30-9 explicitly codifies Qualitative (Q-Factor) Adjustments (lending underwriting shifts, concentration risks, environmental/tariff shocks) on top of quantitative multi-scenario loss engines across the IFRS 9, CECL & Fair Value Accounting topic hub.
Disclosing Scenario Sensitivity (100% Base vs 100% Severe Downside) in Annual Reports#
Leading UK, Canadian, Australian, and Eurozone G-SIBs publish full 100%-weighted scenario ECL tables—letting investors re-weight Base vs Stagflation vs Severe Recession on the fly!
- JensenConvexity = ECLModelUnbiased - ECLPortfolio( Sum{s=1..S} ws * MacroPath_s ) > 0
- TotalAllowance = ECLModelUnbiased + Sum{k=1..K} PMAGovernedk( TargetSegmentk , SunsetDatek )
- Linear Mean-Reversion Beyond R&S Horizon H_RS (e.g., Year 3 -> Year 5 Reversion Window M = 8 Quarters):
- PDProjected(t = HRS + m) = ( 1 - m/M ) * PDMacroModel(HRS) + ( m/M ) * PDLongRunTTC for m = 1..M
Frequently asked questions
Does US GAAP ASC 326 CECL legally require multiple probability-weighted macro scenarios like IFRS 9.5.5.17(a)?
Technically, ASC 326 does not mandate multiple explicit scenarios by statute, provided the single forecast + qualitative (Q-factor) adjustments reflect collective risk without bias; in practice, however, nearly all U.S. Category I–III banks (BofA, JPMorgan, Citi, Wells) run 3-to-5 probability-weighted Moody’s/internal scenarios (e.g., Baseline + S1 + S3 + S4) to capture tail convexity accurately!
Why must a macro Post-Model Adjustment (PMA) also transfer loans from Stage 1 into Stage 2 under IFRS 9?
If management concludes that historical models understate refinancing risk on $15B of Office CRE loans and adds a +$200M PMA, leaving 100% of those $15B CRE loans sitting inside Stage 1 (no SICR) is internally contradictory! EBA and UK PRA thematic reviews require allocating top-side PMAs down to borrower segments and triggering Stage 2 collective transfers.
Can a bank book a NEGATIVE Post-Model Adjustment (reducing model-calculated ECL)?
Yes, when empirically justified—for example, in Q2–Q3 2020 when raw unemployment spiked to 14.7% in the U.S. (which raw econometric equations translated into Great-Depression charge-offs!), banks applied governed in-model / PMA dampening adjustments to reflect unprecedented fiscal stimulus transfers—subject to intense external audit scrutiny!
How many macro scenarios do European and Canadian G-SIBs typically run in quarterly IFRS 9 production?
Typically 3 to 5 scenarios (e.g., Central/Base, Upside, Moderate Downside, and Severe Downside/Stagflation), while some UK banks (e.g., HSBC, NatWest, Lloyds) supplement 4 discrete scenarios with Monte Carlo distribution weights around the central path.
Publication record
- Published
- 13 November 2026
- Updated
- 15 November 2026
- Author
- Arthur Pendleton, CPA, JD
- Review
- Review not recorded
- Automated fact check
- Passed in the stored pipeline record
- Source URLs
- 3 recorded
AI assistance recorded: anthropic/claude-opus-4.6. This field does not establish human review or source verification.
Academic & Institutional Attribution
Cite This Research & Embed Live Data Card
Standard academic & institutional research paper citation format.
Arthur Pendleton, CPA, JD. (2026, November 14). Multi-Scenario Macroeconomic Weighting & Post-Model Adjustments (PMAs / Overlays) in IFRS 9 & CECL. FinLexicon Wiki. https://finlexicon.org/wiki/multi-scenario-macroeconomic-overlays-post-model-adjustments-pmaRelated Ifrs9 Cecl Credit Provisioning & Institutional Briefings
Explore Ifrs9 Cecl Credit Provisioning Hub (20) →Ifrs9 Cecl Credit Provisioning
IFRS 9 Expected Credit Loss, US GAAP ASC 326 CECL, Fair Value Hierarchy & Hedge Accounting GuideIfrs9 Cecl Credit Provisioning
IFRS 7, ASC 326 Vintage Charge-Off Tables & ISA 540 / PCAOB AS 2501 External Audit of Credit Loss EstimatesIfrs9 Cecl Credit Provisioning
Deferred Tax Assets (IAS 12 & ASC 740 Valuation Allowances) vs Basel III CAP30 10% / 17.65% CET1 DeductionsIfrs9 Cecl Credit Provisioning
Held-to-Maturity (HTM) Tainting (ASC 320), IFRS 9.4.4.1 Reclassification & AFS/FVOCI Bond Loss RulesIfrs9 Cecl Credit Provisioning
IFRS 9 Stage 1, Stage 2 & Stage 3 ECL Migration: 12-Month vs Lifetime PD, Net Interest & Cure RulesIfrs9 Cecl Credit Provisioning
US GAAP ASC 326 (CECL): Day-One Lifetime Loss, R&S Reversion & ASU 2025-08 M&A Double-Count ReformIfrs9 Cecl Credit Provisioning
IFRS 9 vs CECL Procyclicality in Stress & Basel CET1 Regulatory Capital Transitional Phase-InsIfrs9 Cecl Credit Provisioning
IFRS 9 SICR Quantitative Calibration: Relative Lifetime PD Ratios vs Absolute Basis-Point ThresholdsCentral Clearing Ccp Waterfall
CCP Assessment Powers & Cooling-Off Periods: Capped Cash Calls vs Uncapped Refills & Bank CapitalCentral Clearing Ccp Waterfall
EU CCP Recovery & Resolution Regulation (CCPRRR 2021/23) vs US Dodd-Frank Title II/VIII: NCWO & Bail-InCentral Clearing Ccp Waterfall
CCP Initial Margin Models (Expected Shortfall vs SPAN 2): 5-Day House vs 7-Day Client MPOR & PortingMonetary Policy
Japan's current account surplus and corporate adjustment
FinLexicon Wiki Data, Benchmarks & Contributor Records
CC BY 4.0 Open Data
Open Institutional Datasets (CSV / JSON) →
Download desk-compiled quantitative series & schemas.
2026 Reference Matrix
2026 Institutional Benchmarks & Thresholds →
Statutory capital, clearing, margin & rate conventions.
Editorial Records
Authors & Review Records →
View named contributors where those records are available.
Complete Index
Master Research & Dossier Archive →
Browse all published briefings by topic pillar & date.